
Power BI reporting
tailored to your data
We design and deliver a solution that connects your systems, automatically refreshes your data, and presents it in clear, easy-to-use reports.






Key benefits of our Power BI solution
With Power BI reporting, all your data is in one place. You see the full context and make decisions faster and with confidence.
- Unified data from ERP, CRM, HR, and Finance
- The same numbers for management, sales, and operations
- Faster, clear decision-making across the company
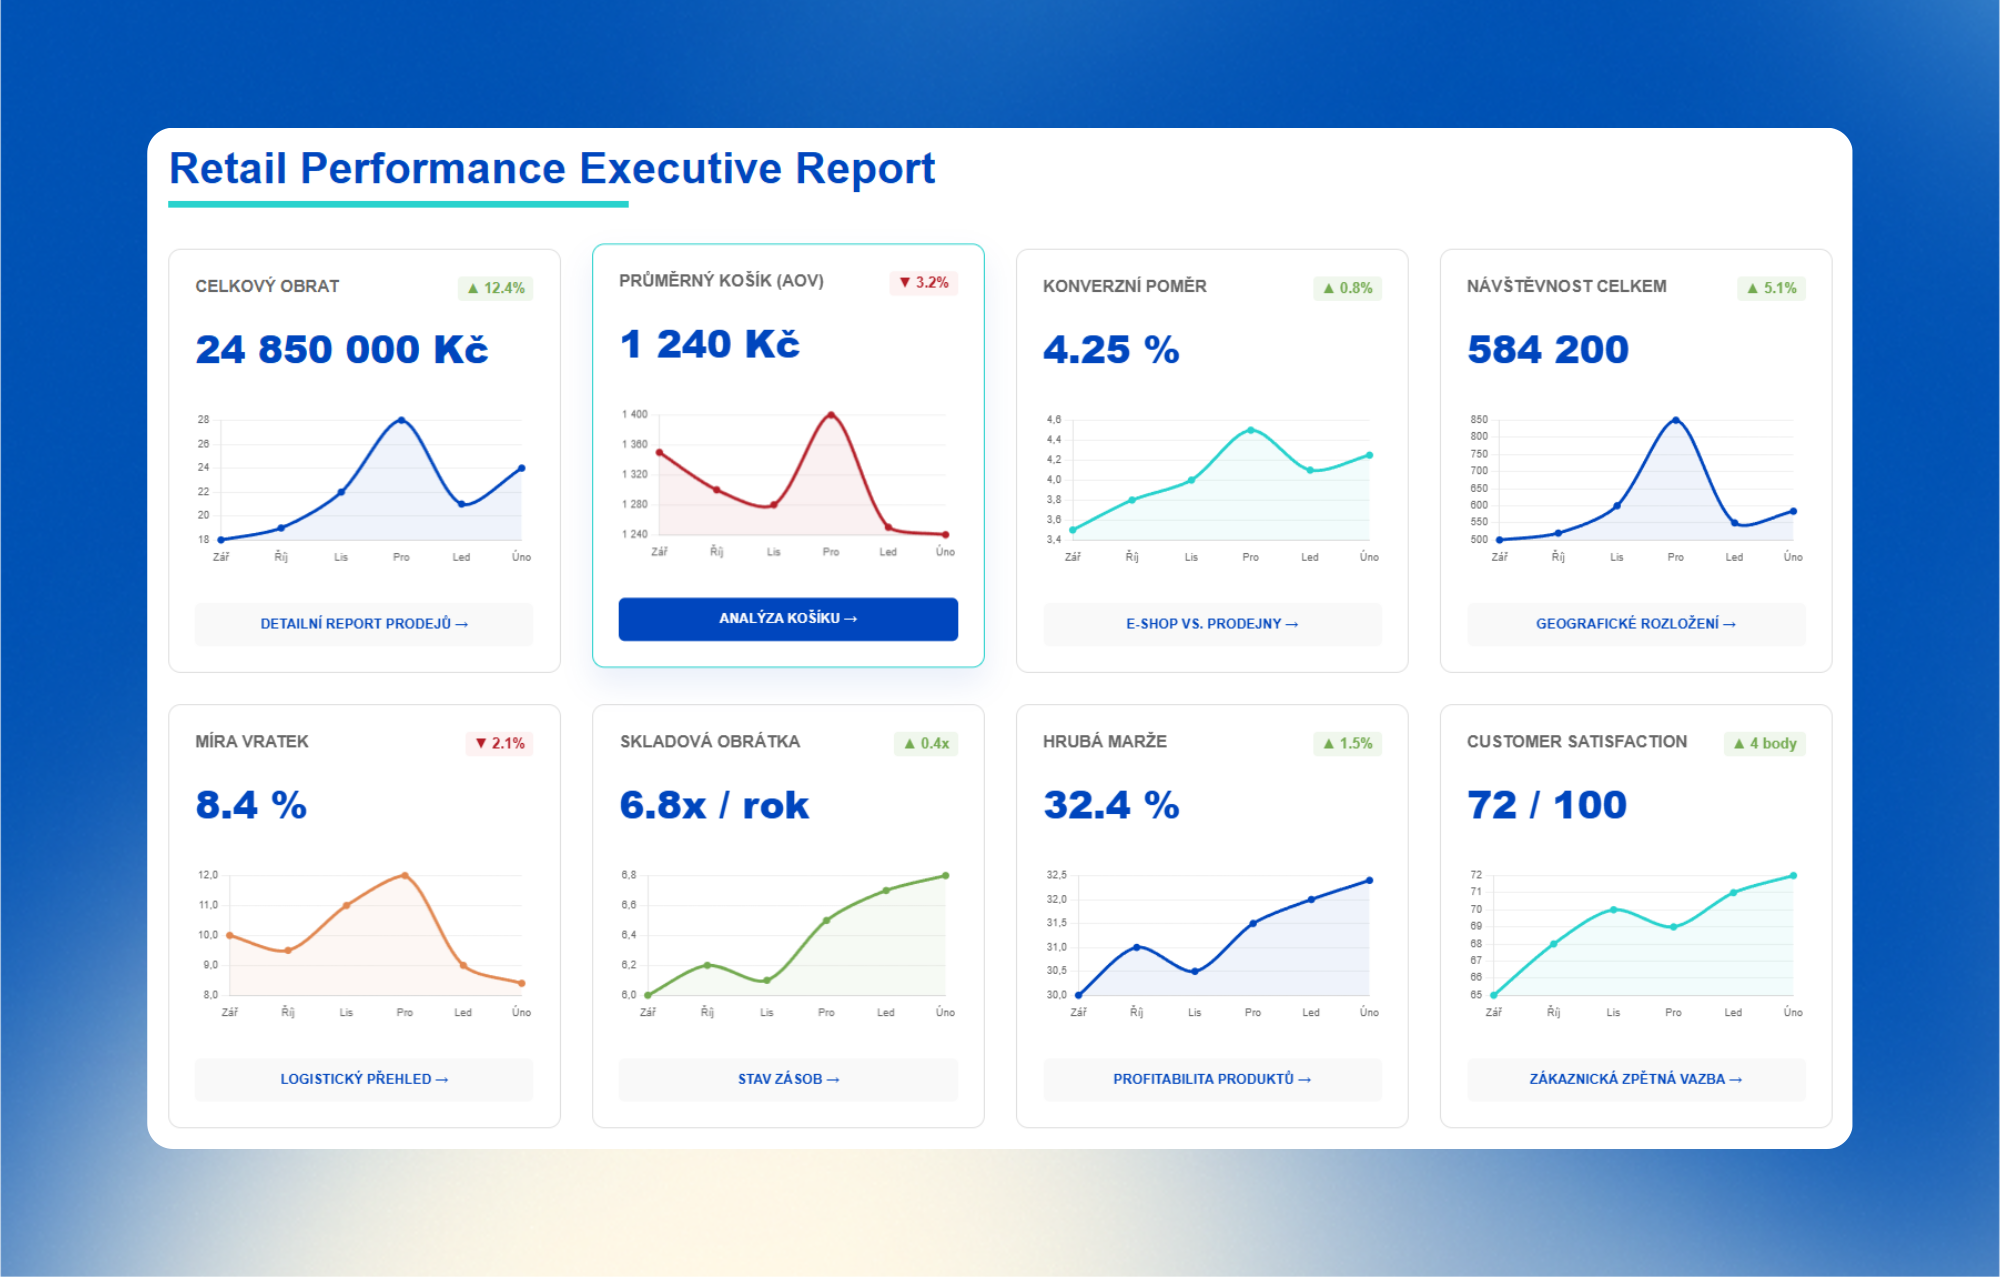
- A consistent, professional visual style that builds trust
- Clear visualizations with a strong narrative
- Mobile reports that keep you informed anywhere
- We set clear data governance rules and define ownership for each domain
- We define unified KPIs and metrics across the company
- We manage access rights and security within Power BI
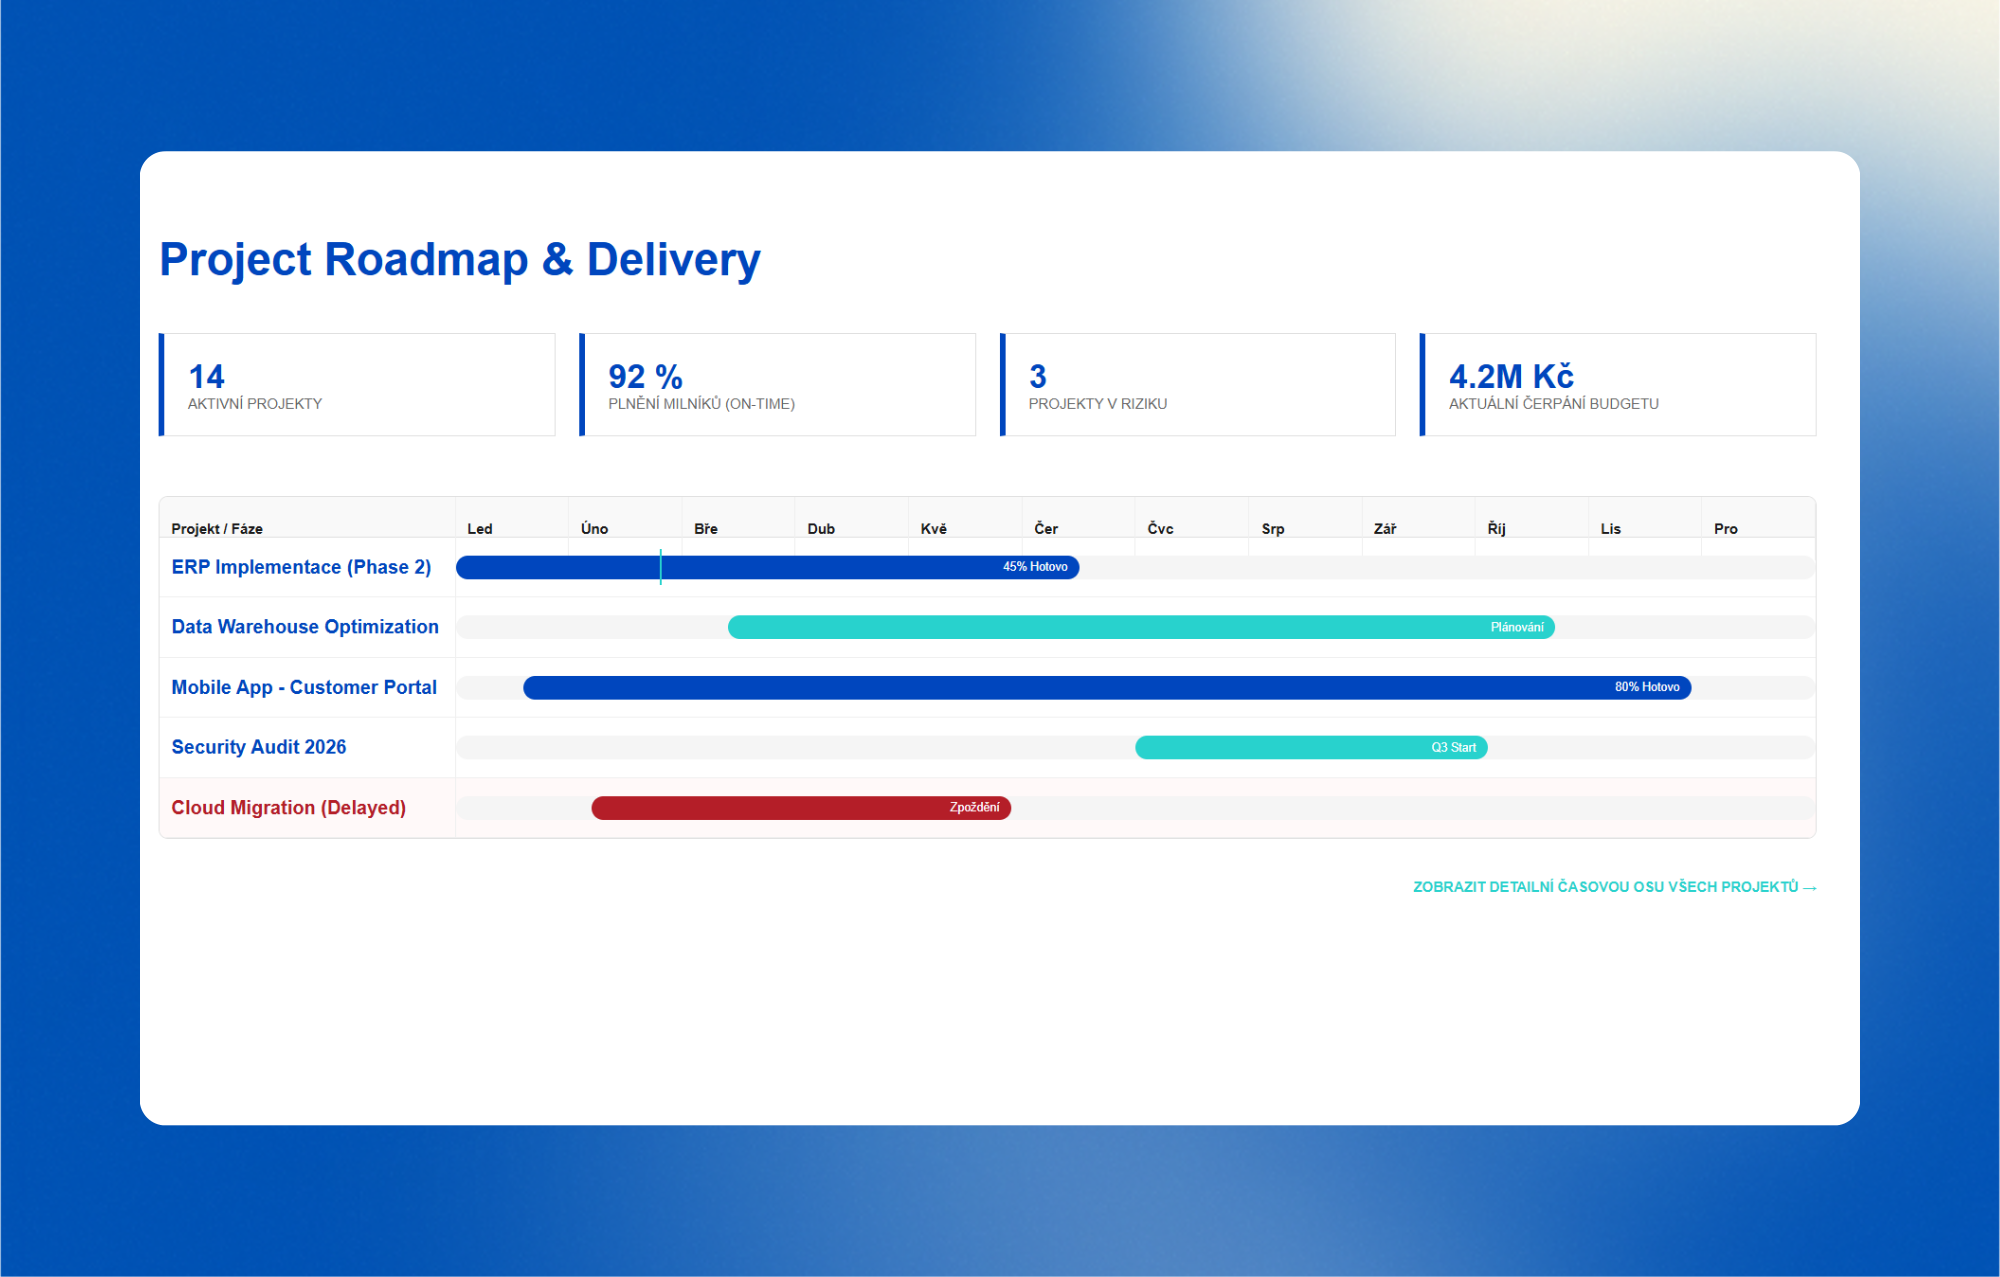
- We adapt your reporting as your business evolves
- Architecture designed for long-term growth
- Easy to extend without complex rework
- Reliable data refresh you can count on
- Focus on analysis with self-service reporting
- Faster response to change with accessible, reliable data
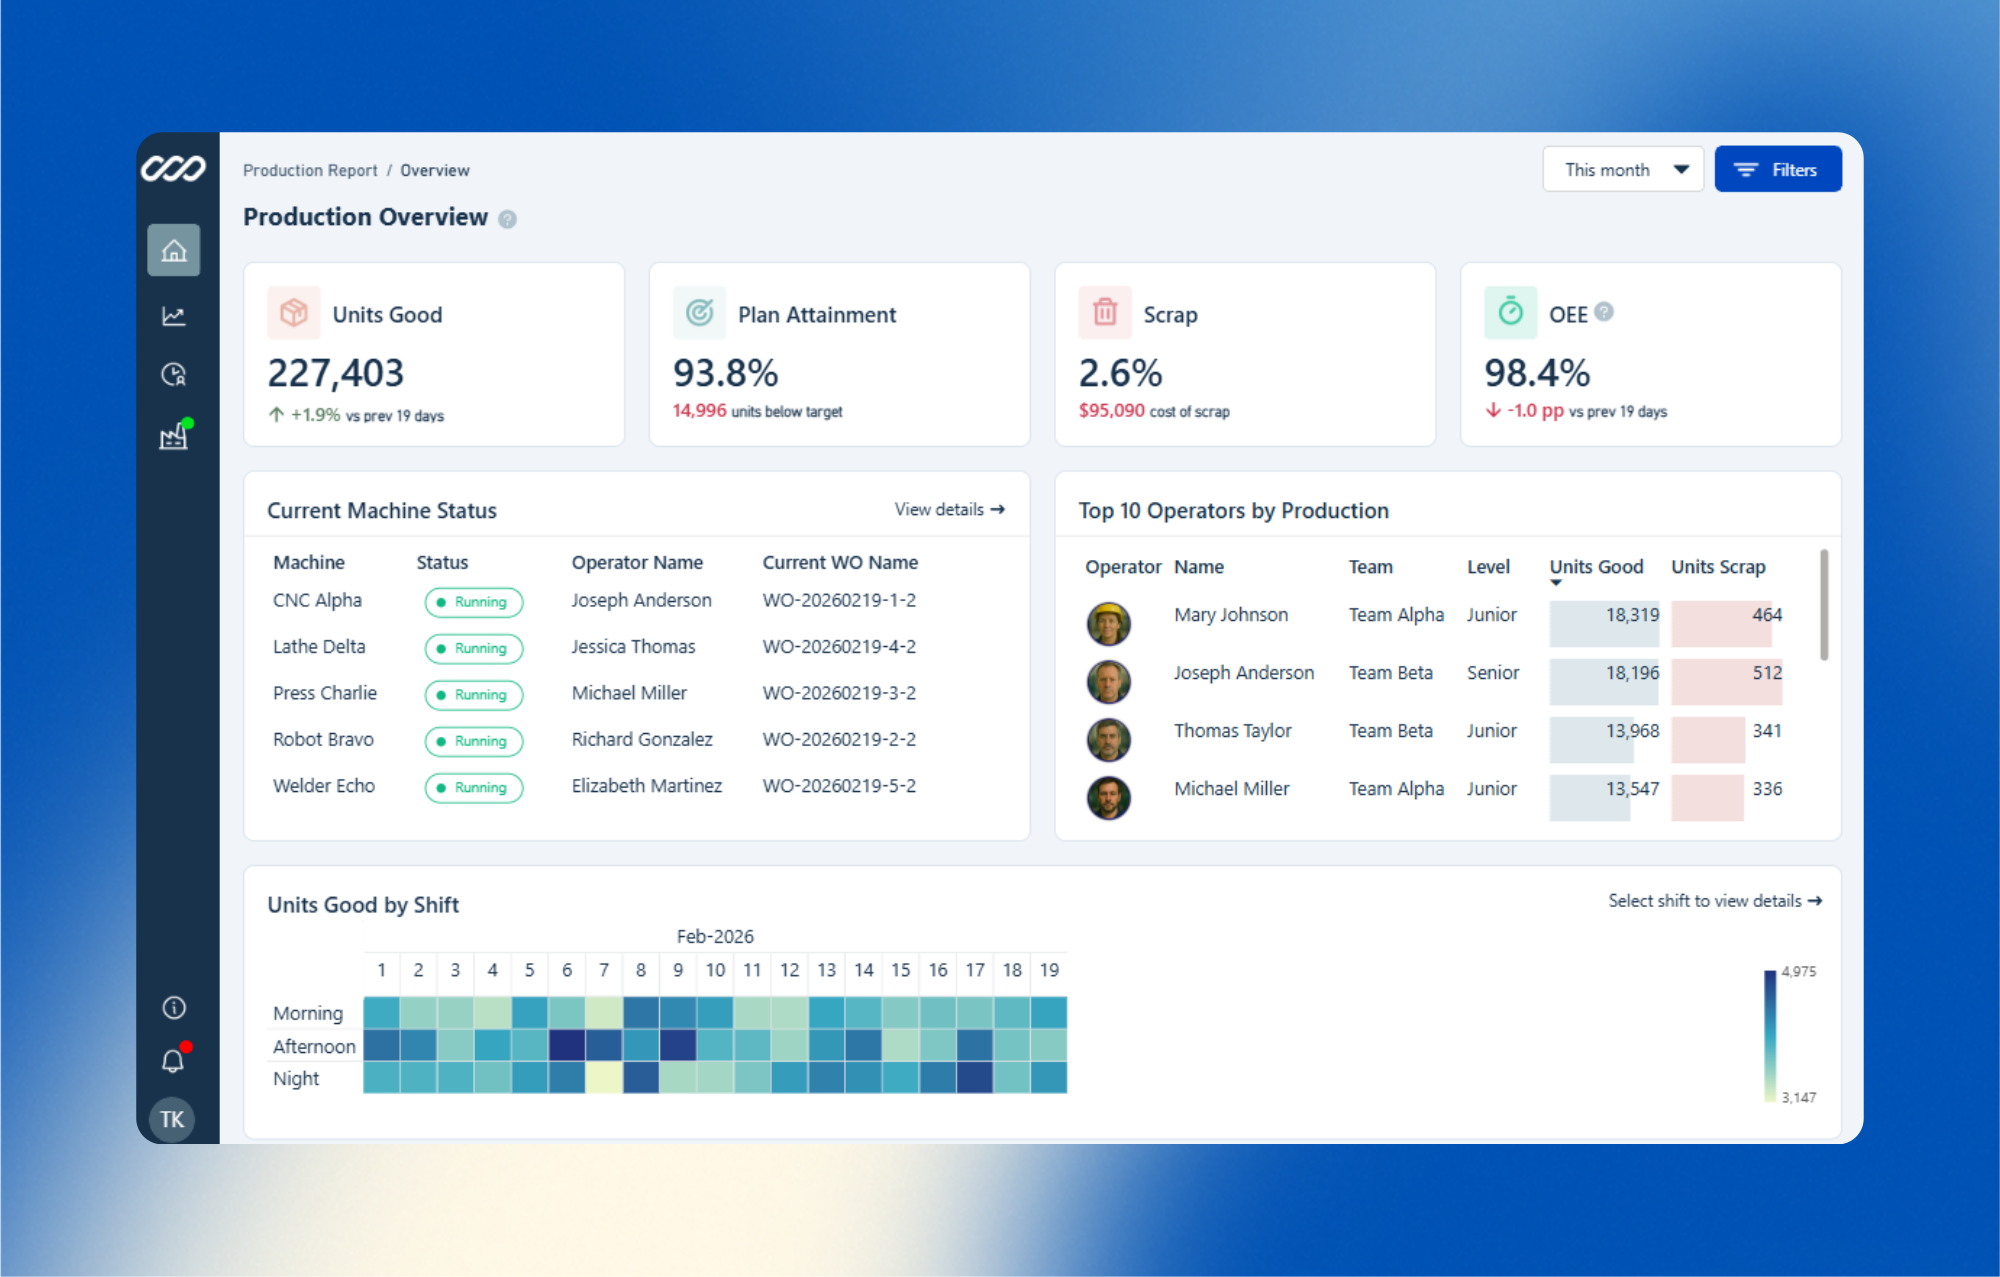
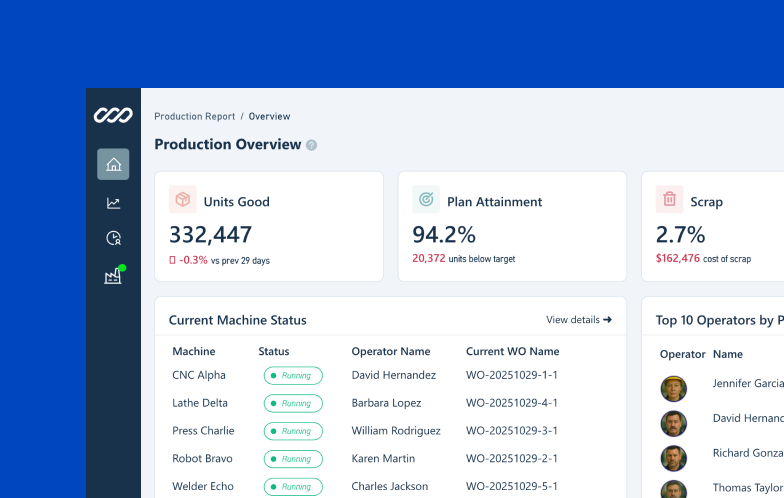
Production report
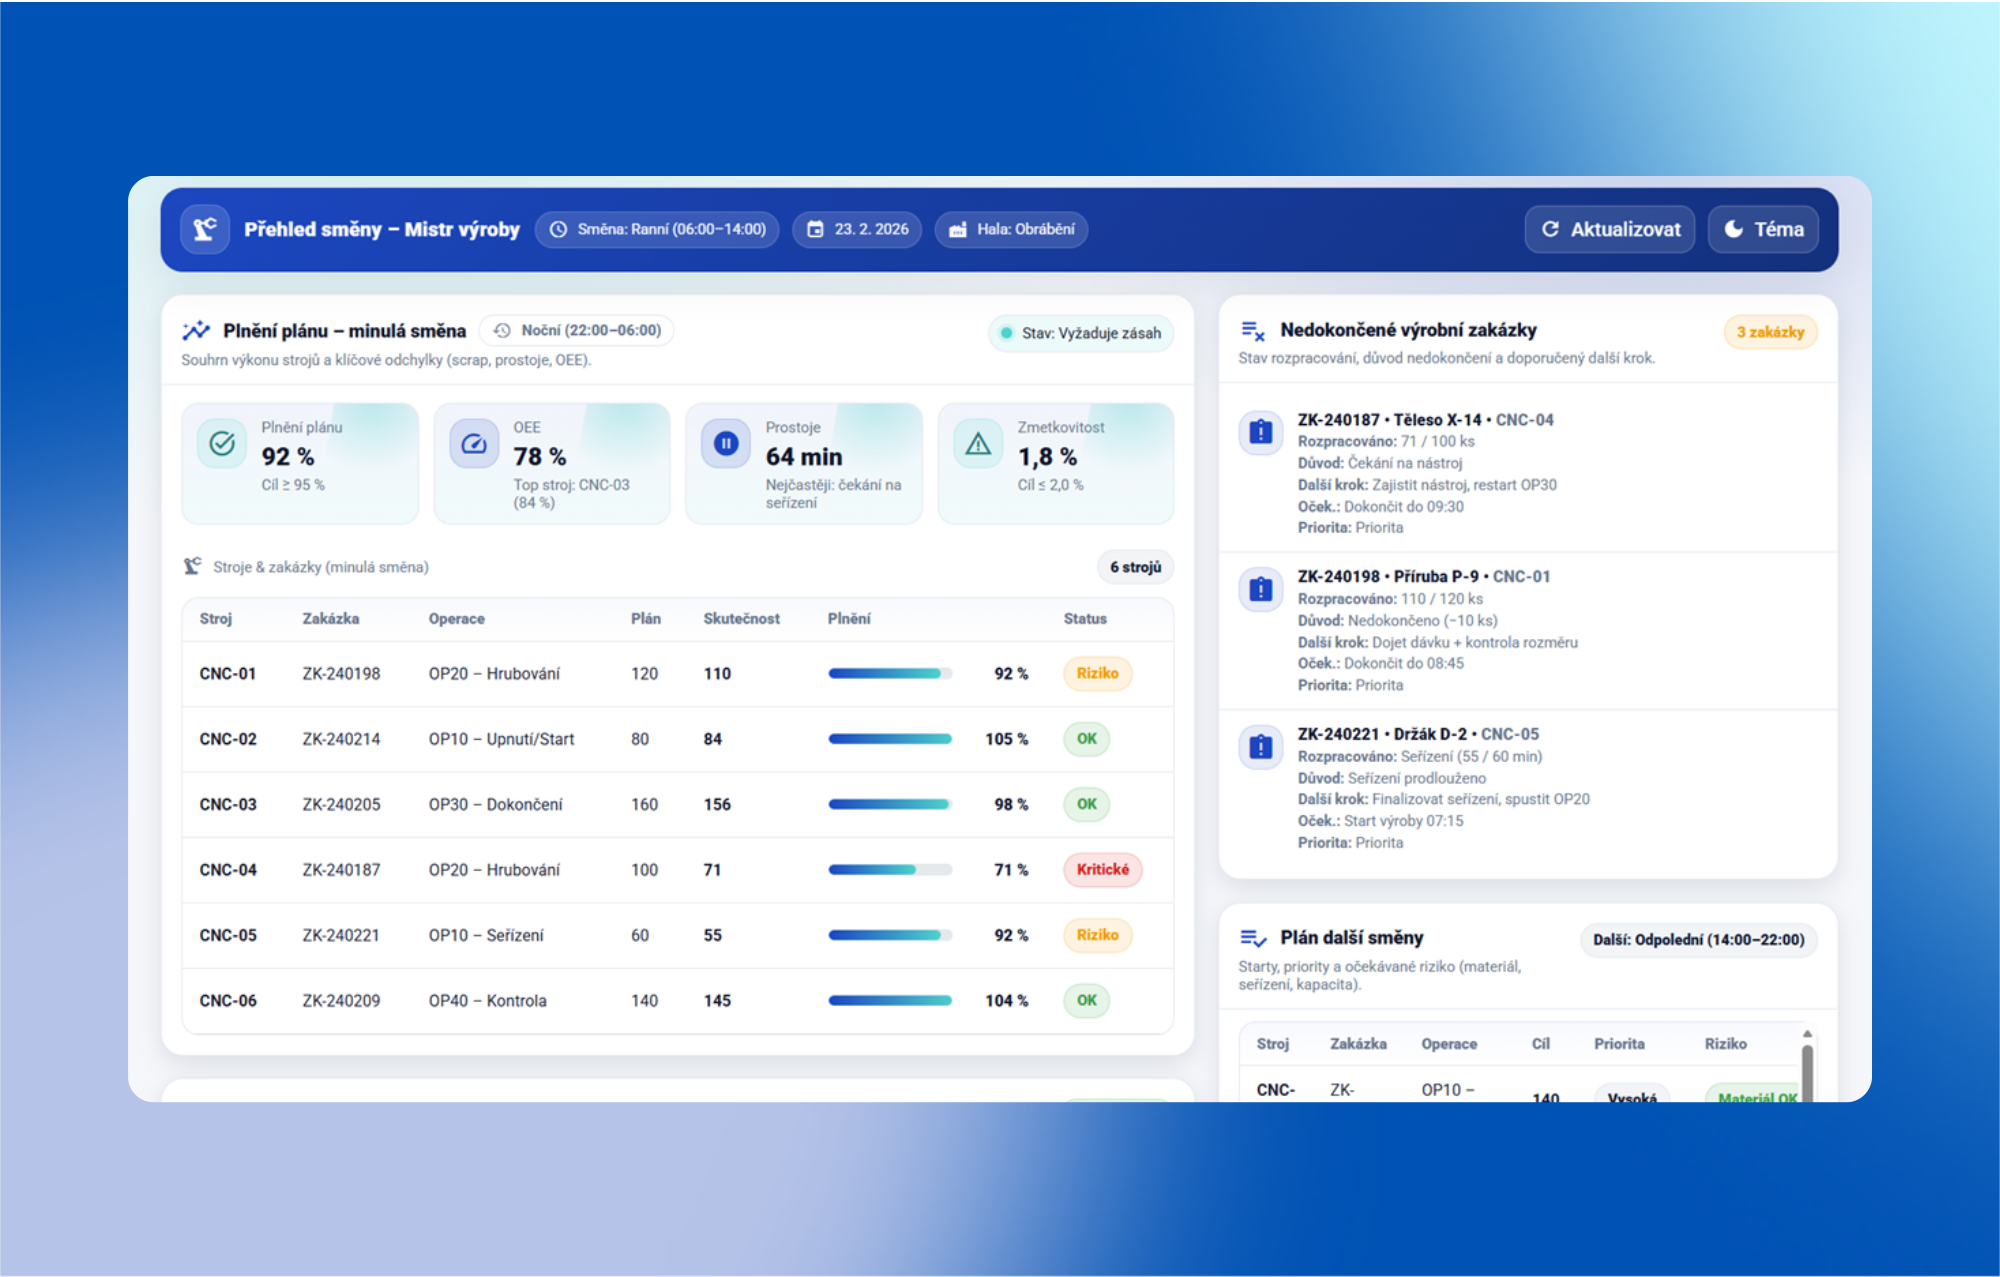
OEE, quality, scrap rate, and OTD in a clear overview everyone can understand.
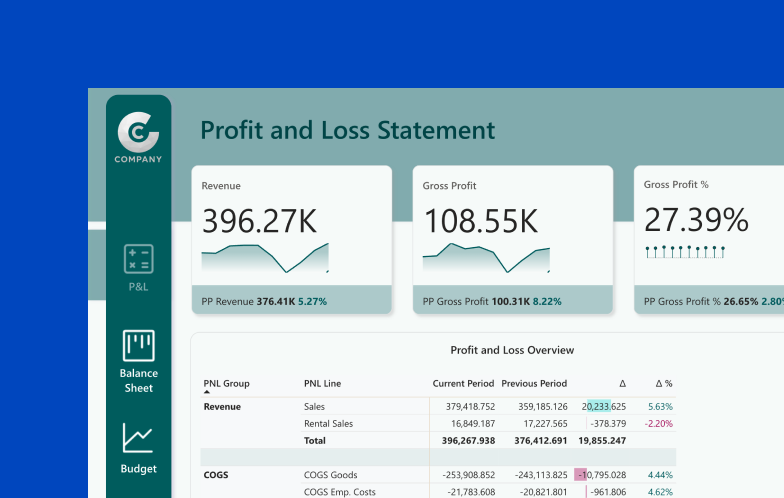
Financial report
From a clear income statement to detailed financial analyses designed to support every role in the company.
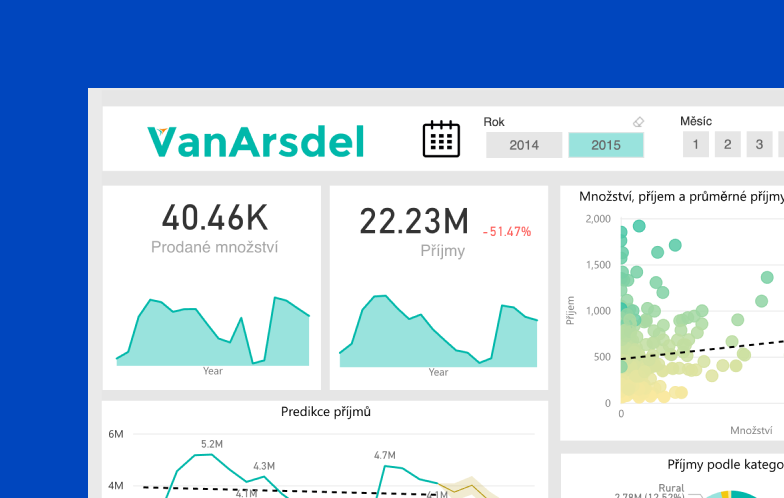
Retail report
Connected data from marketing, sales, and procurement give your business strategies a clear direction.
What we do differently at intecs





How the Power BI implementation works
Definition of requirements
Together, we clarify the problem we are solving and what decisions the reporting should support. We map your business and goals so the solution precisely fits the needs of your company.
Data and data quality analysis
We review the available data, its structure, and its quality to ensure the reporting is built on reliable foundations.
Data model development
We connect the required sources and prepare the transformations. We build a robust data model that ensures fast calculations and allows easy expansion.
Validation and visualization design
Together, we validate the accuracy of the calculations. At the same time, we design the reports and the presentation of key metrics so they are clear and useful for users.
Meet our experts and consultants
in Power BI
We have more than 20 senior consultants who will help you get the most out of your data.
Meet some of them.
Alexandra Profantová
Working with data and tables includes everything that has always fascinated me — a bit of play, a bit of coding. Many small challenges and the opportunity to be many things at once — a developer, analyst, scientist, architect, and in a way, an artist.
Jakub Šmerda
I enjoy when we can turn complex technical solutions into clear, structured outputs that guide clients toward the right business decisions. We give them a perspective they haven’t been able to see before.
Niels Verschatse
Working at intecs makes sense to me because we show clients new ways to understand their business data. I find fulfillment in data analytics and visualization, as well as in sharing knowledge within the team.
Peter Nagy
Intecs means a great team and interesting work with data in BI to me. It also brings together my two passions – mathematics and programming. I’m glad I can fully focus on them in this way.
Jakub Kmeť
Working with data in BI became part of my life a few years ago. At intecs, I took the opportunity to grow, take on new challenges, and I know this will continue to fulfill me for years to come.
We’ll show you how Power BI reporting can save time and money.
- After you submit the form, we will contact you within 2 business days.
- We will schedule a short call to discuss your needs.
- We will propose a solution and send you clear next steps on how to proceed.


FAQ
We answer the most frequently asked questions
Yes, we design and deliver end-to-end solutions—from data architecture through a data warehouse in Azure or Microsoft Fabric to Power BI reporting. We integrate source systems, model data, and build a scalable platform ready for future growth.
We design the architecture based on business goals, data volume, and future scalability. We model data using star schema principles and established data modeling standards. In Power BI, we build an optimized semantic model that ensures performance, metric consistency, and easy maintenance.
Financial reporting is the most common area we work in. Every company needs a clear view of its financial health and performance. We build these solutions on a unified data model and precisely defined metric logic. We handle consolidations, controlling, and drill-down analysis so management can work with consistent and auditable data.
We set up access control (RLS/OLS), sensitivity labels, workspace structure, and deployment pipelines. We audit Power BI tenants and propose concrete steps to improve security, performance, and overall transparency of the environment.
We connect systems such as Dynamics, SAP, Helios, or Pohoda into a central data layer. We design a unified data model that brings together finance, sales, and operations to create a single source of truth across the company.
We design the solution based on the specific scenario—B2B access, guest accounts, or Power BI Embedded within a customer application. We set up licensing, security, and access control to ensure reporting is both secure and cost-efficient.
We provide long-term support, incident resolution, metric development, and roadmap planning. The data platform evolves alongside the business while remaining stable, well-governed, and ready for further expansion.